
Stocks Commentary
Stocks: Fundamentals, Seasonality Tailwinds With Earnings Season On Deck
July 2026
U.S. equity indices posted mixed results in June, with the S&P 500 falling 1%, while small and mid-cap (SMid) indices fared much better, with the S&P Midcap 400 and Small Cap 600 rising 3.4% and 7.1%, respectively. Investors had a lot thrown at them during the month with the long-awaited SpaceX IPO, a new FOMC Chair taking the helm, and quarter-end portfolio rebalancing, just to name a few potentially market-moving events. But after cramming quite a bit of ‘noise’ for market participants into June, earnings season ramping up in mid-July could provide a welcome reprieve and allow investors to again focus on the outlook for corporate profits, which should again be supportive of risk assets.
S&P 500 earnings are estimated to have grown by 22% year-over-year during the second quarter. While this would be a deceleration from the awe-inspiring 25.3% year-over-year earnings growth seen in 1Q26, it would likely be enough for U.S. large cap stocks to find their footing and resume rising after taking June off. The focus should continue to be on the outlook for earnings, and with year-over-year growth projected to reaccelerate to 24.6% in the 3rd quarter, it’s difficult to get too bearish despite the June swoon and shaky start to July. Monetary policy expectations are also worth watching, and should energy prices remain anchored around pre-conflict levels, inflation expectations could move lower and rate hikes could be priced out, which would likely lead to improved risk appetite and sentiment.
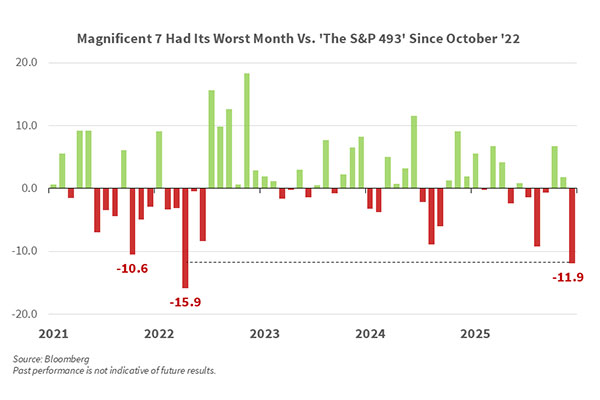
Other than continued strong relative performance out of smaller capitalization stocks, what stood out most in June was the glaring weakness out of the ‘Magnificent 7.’ An equally weighted basket of those names fell by 8.8% during the month, with Tesla’s 3.4% decline the best of the bunch and Microsoft’s 17% monthly drop giving it the distinction of worst performer. The Mag 7 selloff coincided with a pronounced rotation out of the communication services and information technology (IT) sectors, which together account for 47.5% of the S&P 500, as investors grew increasingly concerned about the durability of the rally in AI-related area. Mag 7 members, viewed as some of the biggest expected spenders on AI infrastructure, were hit the hardest amid rumors some were weighing issuing stock to finance their spending booms. Aside from potentially dilutive capital raises, the $75B SpaceX IPO also likely contributed to the pullback in the Mag 7 last month, as these are the most liquid names in the market and are an easily accessible source of funds. As these companies begin to post quarterly results, investors will likely focus on commentary surrounding both AI spending guidance as well as clarity on how these companies intend to fund the buildout. If management teams can ease concerns of dilutive equity raises, then this cohort, along with the broader S&P 500, could resume its ascent.
Small Cap Summer Rolls Along With Offsides Positioning, M&A Outlook Potential Catalysts. Smaller capitalization stocks in the U.S. closed out June and the first half of the year on a high note, with the S&P Small Cap 600 index rising 7.1% on the month and 23% year-to-date. The strength of the rally in small caps this year has been surprising, as the rapid and unsettling rise in energy prices over the March through May timeframe led to inflation expectations being in flux and generated concerns that the FOMC could be tightening monetary policy in the back half of this year. All else being equal, a higher Fed funds rate and economic uncertainty would typically raise borrowing costs for these companies and act as a drag on earnings growth and free cash flow generation. But the S&P 600 has shrugged off the prospect of a more hawkish Fed and uncertainty surrounding energy prices and the U.S. economy, despite the fact that the 600 skews heavily toward economically sensitive areas, with the consumer discretionary, financials, and industrials sectors accounting for 49% of the index, compared to 29% in the S&P 500.
The rally in small caps so far this year has been at least partially a function of offsides positioning as investors crowded into S&P 500 stocks closely tied to the buildout of AI infrastructure last year. But with concerns surrounding AI-related spending and a lack of return on those investments growing louder in recent months, investors have taken profits in mega cap technology and reallocated proceeds into small caps which are relatively less sensitive should AI-related spending ebb. The rebound has likely also been driven by expectations that mergers and acquisitions (M&A) will accelerate this year. The 33.5% rally in the S&P 600 biotechnology industry group year-to-date through last month, with 21% coming in June alone, is evidence that investors are eager to participate in a potential wave of buyout activity and small caps give them a higher beta way to do so. While we have questioned the durability of the improved relative performance out of smaller capitalization stocks in recent months, price is truth and we have little choice but to respect the rally, and if capital continues to flow into the U.S. from abroad and the U.S. dollar steadies or strengthens from here, small caps could continue to perform well in the months to come.
Developed Foreign Markets Outpace Emerging Markets As Investors See Value In ‘Value.’ Economically sensitive sectors led stateside and also gained traction abroad in June as the MSCI EAFE eked out a 0.1% gain while the now tech-heavy MSCI Emerging Market (EM) index was lower by 1.3%. The divergence between the two was evident early in the month as the VIX rose into the low-20s on June 11, leading to a 5% drawdown in the MSCI EM which tested support at its 50-day moving average. During that timeframe the MSCI EAFE was off by a less drastic 2.6%, exhibiting relative strength that is even more encouraging when considering the index quietly made a series of higher highs in May and June. The EAFE’s positive price action coincides with better than anticipated inflation readings out of major European economies last month, causing futures markets to push out the next ECB policy move to March of 2027 instead of September. All told, the near-term trend improvement is intriguing for foreign stocks, but the U.S. Dollar index (DXY) breaking above $100 last month sets up a more difficult backdrop for international stocks over the intermediate term.
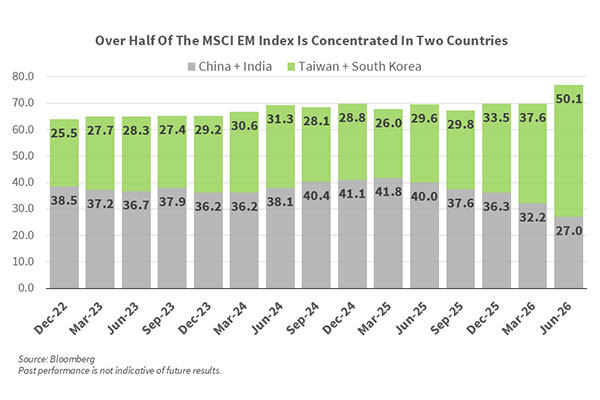
The DXY rallied to close June at $101.18, its highest level since May of 2025, throwing cold water on emerging market equities in the process as the MSCI EM currency index finished June lower by 1.1%. The story in emerging markets comes across as more of a bottom-up narrative, as rising index concentration is creating volatile trading in the broader benchmark. At the end of 2Q, Taiwan and South Korea combined account for more than half of the MSCI EM index, a staggering datapoint considering the pair made up roughly 29.6% of the index just four quarters ago. The insatiable demand for South Korea-based AI-related names led memory maker SK Hynix to file for a U.S. IPO to sell roughly $28B in ADR’s this month. Increased leverage and heightened volatility have been at the forefront in South Korea of late, prompting us to take a more cautious view on South Korea, specifically, and the MSCI EM index broadly as outsized moves are unsettling and likely to weigh on sentiment. If volatility persists and risk appetite wanes, we could see a meaningful deleveraging cycle that could accelerate the sell-off, as history shows leverage unwinds don’t end with a whimper. However, once the pullback in South Korea ends and firmer footing can be found, EM could again be an attractive spot to deploy capital.
As of July 10, 2026
Related Insights
-
 Article
10 min read
Article
10 min read

-
Article

-
Article