3 Key Facts About Student Loans
Previous

Knowing the numbers can help you and your family minimize student loan debt.

A college degree is a major investment, and taking on debt to pay for it can affect your financial wellness—and your stress levels—for years after commencement day. Today’s research can help ensure you make more money and potentially have greater career satisfaction in the future.

  1. College Borrowing Is Falling

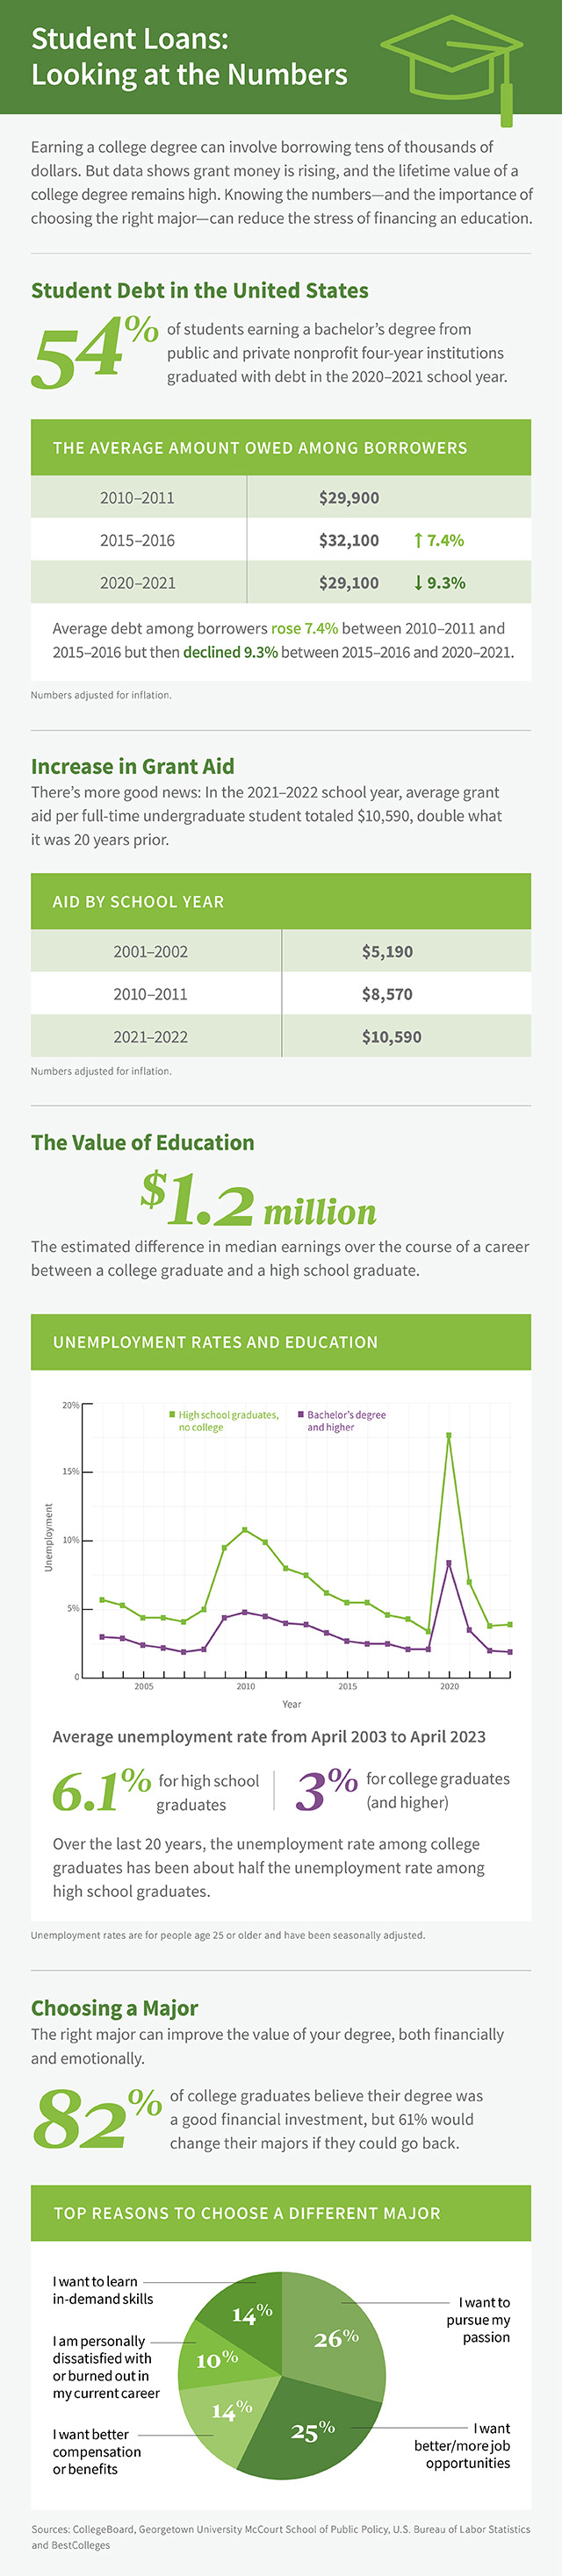
    The good and perhaps surprising news is that college borrowing levels are declining. Between 2015–2016 and 2020–2021, the percentage of bachelor’s degree recipients who graduated from public and private four-year schools with debt fell from 60% to 54%. The average amount these graduates borrowed also fell, from $32,100 to $29,100, after adjusting for inflation.

    One key reason for lower borrowing levels is that college costs have flattened out over the last decade. Tuition, fees and room and board rose just 2% at public four-year schools between 2012–2013 and 2022–2023 and 6% at private nonprofit schools during that 10-year timespan, after accounting for inflation.

  2. Grant Availability Is Rising

    Grant growth is also helping to lower borrowing. On an inflation-adjusted basis, grant aid per student is twice what it was 20 years ago—growing from $5,190 per full-time undergraduate student in 2001–2002 to $10,590 in 2021–2022.

    But many students don’t take advantage of available aid. A study by the National College Attainment Network estimates that students missed out on as much as $3.6 billion in Pell Grants in 2022 alone. Pell Grants are just one of several types of grants available, suggesting the total grant money that went unused was even higher. It’s also not unusual for scholarships to go unused each year, according to the National Scholarship Providers Association.

    Many, but not all, grants are need-based, but some are merit-based, and completing the Free Application for Financial Student Aid (FAFSA) as soon as possible each year gives you the best opportunity to get grant money, which is often awarded on a first-come, first-served basis.

    Online research can help identify scholarship sources, but don’t overlook your local library’s reference section, community organizations and professional organizations—especially if you know what you want to study.

  3. Investment in College Often Pays Off

    By multiple measures, a college degree is a worthwhile investment for most people.

    Over the last 20 years, college-degree holders have had a much easier time finding a job than high school graduates. In fact, the unemployment rate for people with at least a bachelor’s degree has consistently been about half that of people with only a high school diploma.

    A college degree can also increase lifetime earnings by a substantial amount—$1.2 million, according to one estimate—when compared to a high school diploma. But whether that general finding will apply to any one person, and how much more that person might earn by pursuing higher education, depends on many different factors including major, occupation, industry, location and more.

    In fact, 61% of college graduates would change their major if they could go back, in some cases to pursue a life passion, but in many cases to qualify for better job opportunities, pay and benefits. So for many students, it may be worth taking time to explore multiple majors, work part time, shadow professionals, research the outlook for different jobs and work with a career counselor.

    These steps can all come with financial costs and offsetting them may require some flexibility. For example, students could attend a local two-year college and then transfer to a four-year university once they’ve gained a clearer picture of their future. Or they could go to an in-state public university rather than a private university but emphasize finding the right major over finishing in four years. Either option could free up funds for career exploration that can prove valuable in the long run.


Three Things to Do

  1. Get guidance on managing student loan disbursements wisely from Raya Reaves, Founder and Finance Coach at City Girl Savings.
  2. Read about how to live and have fun on a college budget.
  3. Listen to a podcast on how to create a financial plan for college.

This graphic is called, “Student Loans: Looking at the Numbers.” There is an introduction and then a series of stats and charts. The introduction reads, “Earning a college degree can involve borrowing tens of thousands of dollars. But data shows grant money is rising, and the lifetime value of a college degree remains high. Knowing the numbers—and the importance of choosing the right major—can reduce the stress of financing an education.” The first box of the graphic is titled, “Student Debt in the United States.” There is a stat that reads, “54% of students earning a bachelor’s degree from public and private nonprofit four-year institutions graduated with debt in the 2020–2021 school year.” A Chart that shows, “The average amount owed among borrowers: 2010–2011: $29,900; 2015–2016: $32,100; and 2020–2021: $29,100.” Annotations on the chart read “Average debt among borrowers rose 7.4% between 2010–2011 and 2015–2016 but then declined 9.3% between 2015–2016 and 2020–2021.” A note says that “(Numbers adjusted for inflation.)” The next box is titled, “Increase in Grant Aid.” It reads, “There’s more good news: In the 2021–2022 school year, average grant aid per full-time undergraduate student totaled $10,590, double what it was 20 years prior.” A chart in this section shows the grant numbers: “2001–2002: $5,190; 2010–2011: $8,570; and 2021–2022: $10,590.” A note says that “(Numbers adjusted for inflation.)” The next box is titled, “The Value of Education” and reads, “A college degree may involve taking on debt, but it also pays off over a lifetime.” A statistic reads, “$1.2 million: The estimated difference in median earnings over the course of a career between a college graduate and a high school graduate. Plus, over the last 20 years, the unemployment rate among college graduates has been about half the unemployment rate among high school graduates.” A chart in this section shows the, “Average unemployment rate from April 2003 to April 2023.” It was, “6.1% for high school graduates” and “3% for college graduates (and higher).” A note says that “(Based on seasonally adjusted monthly unemployment rates.)” The next box is titled, “Choosing a Major.” It reads, “The right major can improve the value of your degree, both financially and emotionally.” A statistic reads, “82% of college graduates believe their degree was a good financial investment, but 61% would change their majors if they could go back.” A pie chart shows the “Top reasons to choose a different major: I want to pursue my passion: 26%; I want better/more job opportunities: 25%; I want better compensation or benefits: 14%; I am personally dissatisfied with or burned out in my current career: 10%; and I want to learn in-demand skills: 14%.” The sources for the graphic reads, “Sources: CollegeBoard, Georgetown University McCourt School of Public Policy, U.S. Bureau of Labor Statistics and BestColleges.” Click to view personal

personal

This graphic is called, “Student Loans: Looking at the Numbers.” There is an introduction and then a series of stats and charts. The introduction reads, “Earning a college degree can involve borrowing tens of thousands of dollars. But data shows grant money is rising, and the lifetime value of a college degree remains high. Knowing the numbers—and the importance of choosing the right major—can reduce the stress of financing an education.” The first box of the graphic is titled, “Student Debt in the United States.” There is a stat that reads, “54% of students earning a bachelor’s degree from public and private nonprofit four-year institutions graduated with debt in the 2020–2021 school year.” A Chart that shows, “The average amount owed among borrowers: 2010–2011: $29,900; 2015–2016: $32,100; and 2020–2021: $29,100.” Annotations on the chart read “Average debt among borrowers rose 7.4% between 2010–2011 and 2015–2016 but then declined 9.3% between 2015–2016 and 2020–2021.” A note says that “(Numbers adjusted for inflation.)” The next box is titled, “Increase in Grant Aid.” It reads, “There’s more good news: In the 2021–2022 school year, average grant aid per full-time undergraduate student totaled $10,590, double what it was 20 years prior.” A chart in this section shows the grant numbers: “2001–2002: $5,190; 2010–2011: $8,570; and 2021–2022: $10,590.” A note says that “(Numbers adjusted for inflation.)” The next box is titled, “The Value of Education” and reads, “A college degree may involve taking on debt, but it also pays off over a lifetime.” A statistic reads, “$1.2 million: The estimated difference in median earnings over the course of a career between a college graduate and a high school graduate. Plus, over the last 20 years, the unemployment rate among college graduates has been about half the unemployment rate among high school graduates.” A chart in this section shows the, “Average unemployment rate from April 2003 to April 2023.” It was, “6.1% for high school graduates” and “3% for college graduates (and higher).” A note says that “(Based on seasonally adjusted monthly unemployment rates.)” The next box is titled, “Choosing a Major.” It reads, “The right major can improve the value of your degree, both financially and emotionally.” A statistic reads, “82% of college graduates believe their degree was a good financial investment, but 61% would change their majors if they could go back.” A pie chart shows the “Top reasons to choose a different major: I want to pursue my passion: 26%; I want better/more job opportunities: 25%; I want better compensation or benefits: 14%; I am personally dissatisfied with or burned out in my current career: 10%; and I want to learn in-demand skills: 14%.” The sources for the graphic reads, “Sources: CollegeBoard, Georgetown University McCourt School of Public Policy, U.S. Bureau of Labor Statistics and BestColleges.”
Next

Looking for More?

This information is general in nature and is not intended to be legal, tax, or financial advice. Although Regions believes this information to be accurate, it cannot ensure that it will remain up to date. Statements or opinions of individuals referenced herein are their own—not Regions'. Consult an appropriate professional concerning your specific situation and irs.gov for current tax rules. Regions, the Regions logo, and the LifeGreen bike are registered trademarks of Regions Bank. The LifeGreen color is a trademark of Regions Bank.