
Active fixed income management: Beyond the benchmark
See why active management can matter for fixed income, where benchmark construction, liquidity challenges and security selection may help improve outcome
1975, Jack Bogle started a revolution - not with a gunshot, political speech or radical action, but with an idea. An idea that a lower-cost approach to investing focused on tracking a diversified index will, over time, provide better outcomes for investors. By focusing not on attempting to identify and properly value companies and by simply following a rules-based index an investment fund can reduce research expenses and pass the savings onto investors. While this idea was ridiculed by peers as “un-American” or as “a sure path to mediocrity,” Mr. Bogle appears to have had the last laugh as passive assets under management exceeded that of active for the first time in history in 2024. Low costs, simplicity and broad exposures have led many passive investors to positive outcomes worldwide.
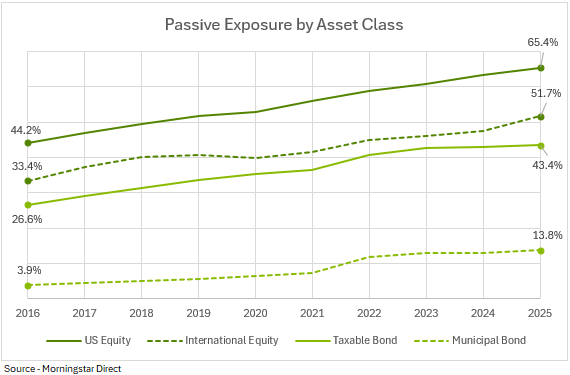
Over the past ten years, passive investing has become even more commonplace in the United States. Shown in the chart above, the majority of assets invested in US and international developed markets are held in passive strategies. As an asset class, fixed income, however, has been much more insulated and resistant to the shift towards passive investing. While there are numerous reasons for this, one of the more commonly cited is the performance of active management. Over the past ten years, the median active manager was successful in outperforming the benchmark on both an absolute and risk-adjusted basis. In this paper, we will review the benchmarks that passive strategies attempt to replicate, some of the inefficiencies that fixed income benchmarks often have and how active fixed income managers in different categories might add value through their investment processes and portfolio construction.
| Percentage of active manager that outperformed the benchmark | ||||
|---|---|---|---|---|
| 3 year | 5 year | 7 year | 10 year | |
| Investment grade debt | 68 | 57 | 66 | 70 |
| High yield debt | 60 | 54 | 66 | 72 |
Source: Morningstar Direct. Investment grade debt compares percentile returns of the iShares Core U.S. Aggregate Bond ETF to the Morningstar Core bond category. High Yield Debt compares percentile return of the iShares iBoxx $ High Yield Corporate Bond ETF to the High Yield Morningstar category. All time periods as of Table compares base return of the iShares Aggregate Bond. Data as of 6/30/26.
To beat the benchmark, you must know the benchmark
Before discussing how active management can outperform, we need to learn more about what exactly they are attempting to outperform. Overall, an investment benchmark is a tool that serves as a representation of an investment universe. Some of the more popular ones are the S&P 500, which tracks the 500 largest U.S. companies, the Russell 2000, which is a collection of 2,000 small cap companies and the NASDAQ 100, which invests in the largest 100 non-financial companies on the NASDAQ exchange. Today, the most well-known fixed income benchmark is the Bloomberg Aggregate Bond Index, commonly referred to as the “Agg.” The Agg is composed of fixed income securities that meet several investment criteria:
- The bond must be U.S. dollar denominated
- The security must have an investment-grade credit rating of BBB- or higher
- The issuance needs to be sufficiently large for inclusion, with minimum size requirements of $300 million for corporate bonds and Treasuries
- The securities must have a fixed rate coupon
If a security meets these criteria, it is automatically included in the index. At the end of 2025, there were 13,940 securities representing $30.9 trillion in assets. However, this rules-based inclusion metric can create several challenges for passive investors.
The impossible trinity: Liquidity, tracking error and transaction costs
When managers seek to construct index-linked investment funds, there are three items that are normally top of mind: liquidity, tracking error and transaction costs. Liquidity for financial assets refers to how easy it is to sell or buy a security without having a material impact on its market price. Equities trade continuously on centralized exchanges such as the NASDAQ and New York Stock Exchange, but fixed income securities, by contrast, often trade less frequently and primarily through over-the-counter transactions facilitated by broker-dealers. Unlike exchanges, pricing in the over-the-counter bond market may vary among dealers and market participants based on prevailing market conditions, inventory, liquidity and transaction size. Knowing that the price of the bonds they hold may not reflect what they could easily turn into cash on short notice, most passive investment funds hold a small amount of their portfolio in cash. This leads us to our second concern - tracking error.
Tracking error measures how closely a portfolio follows the returns of its benchmark. In a perfect world, there would be no difference between the return of the index and a passive fund. However, with the aggregate bond index being made up of nearly 14,000 individual securities, it is very difficult, if not impossible, to exactly replicate. Even if a manager wanted to perfectly replicate, it would then draw us to our third challenge - transaction costs. A manager would need to make hundreds, if not thousands of trades to rebalance the portfolio as money is put in or pulled out of the strategy and each transaction would bear an expense to the strategy. This makes full replication of the index extremely costly. Each passive manager needs to balance out the three factors of minimizing tracking error, minimizing transaction costs and keeping enough liquidity in the portfolio to account for transactions into and out of the fund, which is extremely difficult to balance. In fact, recent academic research from Choi, Cremers and Riley suggests that the average passive bond fund faces an annualized rebalancing cost of 25 bps just from rebalancing, thus causing passive fixed income products to deviate from the index.
Where active management can add value
Having discussed the structural challenges for passive fixed income strategies, we can now turn to the reasons active management may be better positioned to add value. In the next sections, we will review specific areas where active management has historically proven successful.
Changes in benchmark compositions – U.S. investment grade bonds
In investment grade investing, the benchmark that active management attempts to beat has been changing over time. Due to the growth of the U.S. federal debt, Treasuries now make up a much larger percentage of the overall index, more than double what they were only 16 years ago.1 While Treasuries are often seen as a risk-off asset given the very low likelihood of a default, they still carry duration risk, or the risk that the value of the security will fall when interest rates rise. While all fixed-income securities hold some level of duration risk, active managers have the ability to manage their exposure to this risk exposure by holding bonds that will mature faster, shortening their portfolio duration.
An additional challenge created by the change in benchmark is concentration risk. As Treasury issuance has grown, the return of the benchmark has become increasingly tied to government securities. Active managers can evaluate the opportunities present in corporate bonds, securitized assets, agency debt or out-of-benchmark exposures that offer what they view as more favorable risk-reward balances. The portfolio management team may determine that different risk exposures offer more attractive risk-reward characteristics under certain market conditions and may introduce credit risk, prepayment risk, structure risk or other types of risks into portfolios to create a potentially better outcome for clients. Historically, many active managers have sought to add value through these approaches on an absolute and risk-adjusted basis over the past 3-year, 5-year, 7-year and 10-year periods.
Credit selection in high yield
Within fixed income indices, the largest borrowers generally account for a larger weighting in the benchmark while issuers with less debt typically have a smaller index exposure. While this is entirely reasonable for the index provider, this does present a challenge. Companies with higher debt balances and borrowing costs may be more susceptible to financial distress or bankruptcy than those with lower levels of debt, all else equal. When a bond defaults, it often causes a material loss for the security, with investors seeing an average loss between 45 to 60 percent. Given the upside return in fixed income is limited to the interest paid and the return of principal identifying securities that may be more prone to default through sound credit analysis of the issuer provides a path for active fixed income to improve relative performance. This is seen most commonly in high yield debt, which are securities that typically carry larger debt loads and are more subject to default risk.
Municipal bond opportunities
While we earlier argued that fixed income benchmarks are inefficient relative to equities, municipal benchmarks tend to be even more challenging. There are approximately one million distinct municipal bonds in the investment universe, ranging from massive issuers like the New York City transportation system to small school districts that support a single school in a particular county. Smaller issuers face challenges in issuing debt as well in the form of rating agency costs. While a larger issuer can afford to have S&P or Moody’s review the issuance and place a rating on their debt, a $7,500 to $500,000 expense to rate municipal debt can be material a material cost for smaller credits. As a result, roughly 34% of municipal debt comes to market without a rating. This can present an opportunity for active investors to find mispriced credits in a market without ratings.
Active management can also be beneficial in municipals due to a unique structure found in most municipal debt. Historically, about 80% of all municipal debt securities have call options embedded into the bond, which allows the municipality to pay back the debt prior to final maturity. These call features give local governments the opportunity to refinance its debt at lower rates if interest rates fall. However, there are fixed costs that are involved in calling and reissuing new debt. In fact, there are times when it is more economical for a municipality to not call back the debt and continue to pay higher-than-market interest rates. If active management can identify, purchase and integrate these securities into their portfolios, it can potentially generate stronger performance.
Conclusion
Jack Bogle’s passive revolution fundamentally changed the way investors access markets. In equities, where markets are highly liquid, transparent and relatively easy to replicate, passive strategies have proven difficult to beat. Fixed income, however, presents a different set of challenges due to structural issues in trading, liquidity and benchmark construction. This presents opportunities for active managers to add value through security selection, credit research, risk management and diligent portfolio construction. While passive strategies will continue to be an ever-present part of the investment landscape, fixed income remains an area where active management may offer opportunities to add value – not by rejecting Bogle’s lessons on cost and simplicity, but by alleviating inefficiencies as markets were designed to do.
Talk to your Regions Wealth Advisor about:
- Your preferences for regular meetings about your portfolio.
- How to receive Regions Asset Management weekly market commentary.
1. Data per Morningstar Direct – Data from the iShares Core U.S. Aggregate bond’s long exposure to U.S. Treasury debt from June 2010 to June 2026.
Related Insights
-
 Article
9 min read
Article
9 min read

-
Article
15 min read

-
Article
15 min read